[Extracted from] [1912] LEICESTER: SANITATION versus VACCINATION BY J.T. BIGGS J.P.
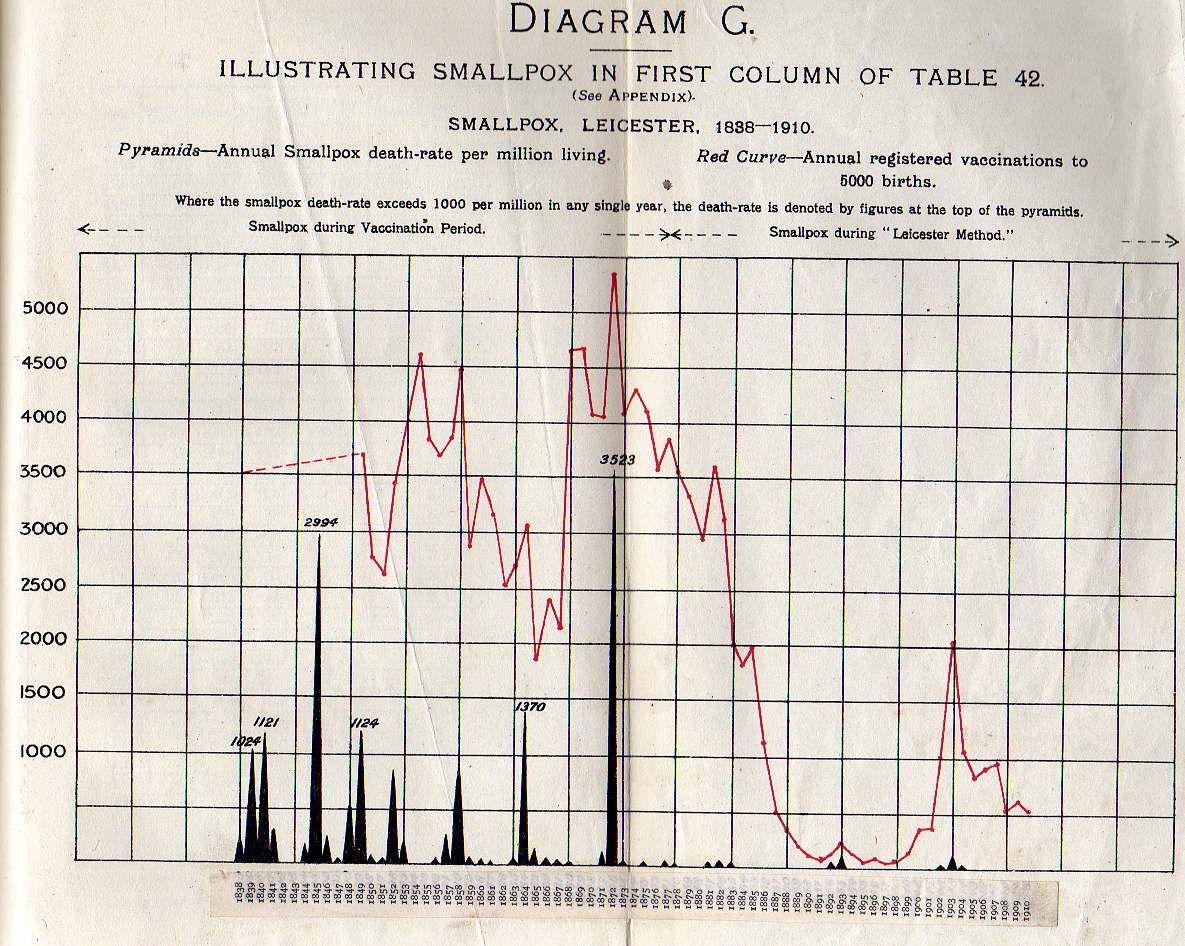
Table 42 & Graph (Diagram) G
Being Table 16, Royal Commission, Fourth Report,
carried to 1910.
Table showing, for the BOROUGH OF LEICESTER, for
each of the years 1838-1910, the number of deaths from each of the seven
principal zymotic diseases per million living, with, for each
of the years 1849-1910, the percentage of registered vaccinations to births.
(See Diagram G for smallpox).
Table 42 showing, for the BOROUGH OF LEICESTER, for each of the years 1838-1910, the number of deaths from each of the seven principal zymotic diseases per million living, with, for each of the years 1849-1910, the percentage of registered vaccinations to births.* (See Graph G for smallpox).
|
Year |
Smallpox |
Measles |
Scarlet Fever |
Diptheria * |
Whooping Cough |
Fevers |
Diarrhoea |
Totals | Percentage of registered Vaccinations to total Births |
|
1838 |
230 | 104 | 21 | 42 | 565 | 1,319 | 963 | 3,244 | Not known |
|
1839 |
1,024 | 860 | 41 | 103 | 840 | 1,374 | 1,000 | 5,242 | |
|
1840 |
1,121 | 3,703 | 1,942 | 80 | 440 | 1,932 | 2,322 | 11,531 | |
|
1841 |
607 | 156 | 1,460 | 78 | 254 | 1,666 | 1,901 | 6,131 | |
|
1842 |
0 | 1,694 | 268 | 96 | 521 | 1,367 | 1,694 | 5,640 | |
|
1843 |
0 | 1,549 | 284 | 0 | 322 | 776 | 1,174 | 4,105 | Returns incomplete |
| 1844 | 167 | 74 | 1,804 | 56 | 1,172 | 781 | 1,395 | 5,449 | |
|
1845 |
2,994 | 2,758 | 1,351 | 37 | 164 | 657 | 1,114 | 9,075 | |
|
1846 |
215 | 72 | 180 | 18 | 198 | 3,170 | 4,260 | 8,113 | |
|
1847 |
18 | 494 | 53 | 70 | 952 | 864 | 1,676 | 4,127 | |
|
1848 |
537 | 1,040 | 243 | 0 | 398 | 1,421 | 2,235 | 5,874 | |
|
1849 |
1,124 | 1,157 | 85 | 34 | 1,022 | 1,516 | 2,112 | 7,050 | 74.2 |
|
1850 |
84 | 803 | 184 | 50 | 167 | 1,355 | 1,489 | 4,132 | 55.3 |
|
1851 |
33 | 594 | 806 | 0 | 214 | 1,168 | 2,666 | 5,481 | 53.0 |
|
1852 |
846 | 49 | 2,603 | 81 | 1,025 | 1,317 | 2,506 | 8,427 | 68.6 |
|
1853 |
177 | 128 | 659 | 32 | 563 | 1,672 | 2,220 | 5,451 | 80.7 |
|
1854 |
0 | 2,050 | 159 | 95 | 270 | 1,604 | 2,480 | 6,658 | 92.6 |
|
1855 |
0 | 16 | 78 | 47 | 110 | 850 | 1,776 | 2,877 | 76.9 |
|
1856 |
16 | 233 | 171 | 31 | 342 | 528 | 1,785 | 3,106 | 73.7 |
|
1857 |
261 | 1,013 | 1,566 | 76 | 491 | 1,688 | 3,102 | 8,197 | 77.0 |
|
1858 |
804 | 834 | 2,655 | 61 | 501 | 1,397 | 1,818 | 8,070 | 88.9 |
|
1859 |
45 | 795 | 585 | 150 | 1,290 | 570 | 1,560 | 4,995 | 57.5 |
|
1860 |
30 | 89 | 30 | 30 | 103 | 163 | 830 | 1,275 | 68.9 |
|
1861 |
15 | 1,806 | 15 | 58 | 597 | 888 | 2,332 | 5,711 | 63.4 |
|
1862 |
0 | 84 | 197 | 28 | 620 | 690 | 1,394 | 3,013 | 50.9 |
|
1863 |
68 | 1,227 | 3,182 | 93 | 418 | 688 | 2,292 | 7,968 |
54.7 (104.4) * |
|
1864 |
1,370 | 39 | 619 | 26 | 500 | 487 | 2,371 | 5,412 | 61.5 |
|
1865 |
127 | 1,095 | 102 | 38 | 254 | 713 | 2,877 | 5,206 | 36.7 |
|
1866 |
37 | 160 | 111 | 37 | 566 | 653 | 1,811 | 3,375 | 48.1 |
|
1867 |
24 | 24 | 479 | 36 | 742 | 503 | 2,504 | 4,312 | 43.2 |
|
1868 |
12 | 2,843 | 103 | 115 | 69 | 725 | 4,017 | 7,884 | 94.2 |
|
1869 |
0 | 478 | 89 | 100 | 778 | 634 | 3,025 | 5,104 | 94.7 |
| 1870 | 0 | 452 | 2,833 | 118 | 700 | 560 | 2,585 | 7,248 | 81.7 |
| 1871 | 125 | 368 | 1,176 | 74 | 336 | 588 | 3,171 | 5,838 | 81.1 |
| 1872 | 3,523 | 366 | 51 | 20 | 519 | 651 | 3,105 | 8,235 | 107.1 |
| 1873 | 20 | 615 | 60 | 69 | 635 | 545 | 3,115 | 5,059 | 83.0 |
| 1874 | 0 | 232 | 174 | 77 | 416 | 464 | 2,489 | 3,852 | 86.1 |
| 1875 | 9 | 463 | 1,654 | 66 | 859 | 605 | 2,911 | 6,567 | 82.6 |
| 1876 | 0 | 461 | 1,593 | 92 | 304 | 396 | 2,422 | 5,268 | 71.7 |
| 1877 | 54 | 359 | 296 | 80 | 583 | 179 | 1,661 | 3,212 | 76.9 |
| 1878 | 9 | 394 | 105 | 44 | 718 | 271 | 2,646 | 4,187 | 70.6 |
| 1879 | 0 | 616 | 899 | 94 | 521 | 179 | 753 | 3,062 | 67.0 |
| 1880 | 0 | 1,383 | 991 | 192 | 224 | 383 | 3,316 | 6,489 | 59.4 |
| 1881 | 16 | 57 | 1,495 | 89 | 991 | 238 | 1,568 | 4,454 | 72.5 |
| 1882 | 40 | 586 | 571 | 40 | 150 | 150 | 1,695 | 3,232 | 64.0 |
| 1883 | 23 | 116 | 703 | 46 | 456 | 77 | 1,145 | 2,566 | 40.6 |
| 1884 | 0 | 430 | 475 | 83 | 497 | 121 | 2,594 | 4,200 | 36.3 |
| 1885 | 0 | 382 | 829 | 102 | 382 | 264 | 1,366 | 3,325 | 39.3 |
| 1886 | 0 | 308 | 315 | 29 | 193 | 136 | 1,832 | 2,813 | 23.1 |
| 1887 | 0 | 607 | 35 | 90 | 384 | 217 | 1,724 | 3,057 | 10.0 |
| 1888 | 0 | 524 | 27 | 89 | 585 | 218 | 1,008 | 2,451 | 6.5 |
| 1889 | 0 | 412 | 39 | 66 | 173 | 146 | 1,468 | 2,304 | 3.6 |
| 1890 | 0 | 194 | 246 | 71 | 104 | 156 | 1,412 | 2,183 | 2.7 |
| 1891 | 0 | 474 | 96 | 78 | 767 | 164 | 1,150 | 2,729 | 1.9 |
| 1892 | 33 | 696 | 226 | 55 | 288 | 94 | 1,141 | 2,533 | 2.3 |
| 1893 | 84 | 282 | 440 | 108 | 608 | 255 | 2,162 | 3,939 | 4.3 |
| 1894 | 0 | 566 | 160 | 64 | 64 | 144 | 931 | 1,929 | 2.2 |
| 1895 | 0 | 152 | 78 | 188 | 456 | 199 | 1,904 | 2,977 | 1.3 |
| 1896 | 0 | 618 | 247 | 273 | 242 | 206 | 1,369 | 2,955 | 1.4 |
| 1897 | 0 | 60 | 369 | 374 | 415 | 202 | 1,768 | 3,188 | 1.3 |
| 1898 | 0 | 1,046 | 208 | 313 | 94 | 134 | 1,399 | 3,194 | 1.4 |
| 1899 | 0 | 151 | 205 | 1,083 | 411 | 137 | 1,364 | 3,351 | 3.5 |
| 1900 | 0 | 234 | 134 | 1,514 | 220 | 124 | 1,430 | 3,656 | 7.5 |
| 1901 | 0 | 80 | 28 | 729 | 362 | 94 | 1,120 | 2,413 | 7.8 |
| 1902 | 23 | 337 | 51 | 134 | 310 | 55 | 633 | 1,543 | 20.8 |
| 1903 | 95 | 336 | 68 | 127 | 163 | 59 | 604 | 1,452 | 41.3 |
| 1904 | 18 | 143 | 18 | 27 | 397 | 62 | 1,289 | 1,953 | 21.4 |
| 1905 | 0 | 232 | 158 | 48 | 219 | 39 | 925 | 1,622 | 16.7 |
| 1906 | 0 | 345 | 224 | 116 | 482 | 60 | 1,111 | 2,339 | 18.3 |
| 1907 | 0 | 254 | 186 | 72 | 59 | 21 | 309 | 902 | 19.7 |
| 1908 | 0 | 695 | 121 | 37 | 125 | 33 | 500 | 1,510 | 11.6 |
| 1909 | 0 | 446 | 94 | 57 | 209 | 20 | 434 | 1,260 | 12.2 |
| 1910 | 0 | 52 | 60 | 44 | 213 | 40 | 281 | 690 | 10.5 |
* For the actual number of annual vaccinations, and the extra vaccinations, 1863-64, see table 50.