Swine flu 2009
Toxic air
Swine Flu School
Epidemics: Air Toxicology
by Jim West
June 2010
http://townsendletter.com/June2010/swine0610.html
Dedicated to Nicholas Regush, ABC
News1
This article is reprinted with permission from Jim West.
Chemical and Viral Symptoms
London Smog Coverup
Heat Wave Epidemics
SARS
New York Avian
Mortality
Epicenter
1: St. Francis Prep School
Area Pollution
St. Francis: A
Ballpark Study
Stressors Summed
Random Stressors
Wind speed: Slow.
April 23, 2009:
Epidemic Apex
Wind Vector Study
Wind Patterns 3ñ4 a.m.
Wind
Patterns 8ñ9 a.m.: Satellite View
Wind Before vs. During
NYCDOH Bar Graph.
A Classic Epidemic
Nurse Interview
NYCDOH Questioned
AIRNow
Pollution Maps and Spring Break
Related Case
Epicenter 2: Rye School (Westchester, New York)
Epicenter 3:
Deer Park Schools
Discussion
This article argues for mandatory air pollution
review during flu diagnoses. It also argues that public perception of air
pollution is minimized for reasons of industrial economics and politics, by way
of laws, rules, education, mainstream news, and paradigm promotions embedded in
entertainment.
Flu is nearly always considered viral, as evidenced by a search of the CDC (Centers
for Disease Control) website, the New York Times,
or any media. Medical campaigns vaccinate millions worldwide, purporting to
protect against flu epidemics, yet the symptoms of viral flu are the same as
those of toxicological flu, and flu epidemiology makes toxicological sense.
The omission of air pollution from flu diagnostics is a "mistake," according to
Wikipedia, with respect to carbon monoxide poisoning: "Carbon monoxide is the
most common cause of poisoning worldwide, often mistaken for a viral syndrome
such as influenza."2
Carbon monoxide (CO) serves as a good example for this commentary because it is
well documented and commonplace. CO is just one of many toxic exhaust components
emitted by internal combustion engines.3
Chemical and Viral Symptoms
According to the journal Occupational Health and Safety: "Carbon
monoxide's effects are similar to flu symptoms, including dizziness, headaches,
disorientation, visual disturbances, nausea, and fatigue."4
Maimonides Medical Center: "These symptoms include, headache, nausea, vomiting,
dizziness, fatigue."5
Both so-called viral flu and chemical flu can cause severe neurological disease
and death. There are few diseases that engine exhaust cannot cause, from chronic
and acute exposure.6
Vehicular exhaust contains thousands of components, many of which are toxic; for
example, carbon monoxide, formaldehyde, MTBE (methyl tertiary-butyl ether),
acrolein, toluene, aldehydes, sulfur dioxide, sulfuric acid, hydroperoxyl
radicals, benzene, arsenic, hydrogen cyanide, nitropyrenes, polycyclic aromatic
hydrocarbons (PAHs), methane, phenol, 1,3-butadiene, phenol, ethylene, methane,
NO, NO2, and acetaldehyde.7
Given that air pollution disease is "often mistaken for a viral syndrome," how
often does this mistake occur?
Dolan et al. performed a hospital study to
determine the frequency of this error. They reported:
"No patient with a carboxyhemoglobin level
greater than or equal to 10% [i.e., indicative of subacute CO poisoning or
greater] was diagnosed as having CO poisoning. ..." (They were all diagnosed
with viral flu.)
"[T]he literature is well supplied with reports
of patients with subacute CO poisoning who were misdiagnosed as having
[virus] influenza and sent home with disastrous consequences." (Disaster
also strikes before being sent home.)
"Physicians must seek out the possibility of CO toxicity in patients with
flu-like illness. ... Physicians must ... correctly diagnose patients and
avoid a return to a hazardous environment with potentially fatal
consequences."8
In a study titled "CO Poisoning: An Occult
Epidemic," by Sadovnikoff et al., we find a useful diagnostic rule: "Carbon
monoxide poisoning must be considered when two or more patients are similarly or
simultaneously sick."9
In late April 2009, as the swine flu epidemic emerged in New York City, Charles
D. Connor, president and CEO of the American Lung Association, was quoted in a
press release: "Six out of 10 Americans live in areas dirty enough to send
people to the emergency room, to shape how kids' lungs develop, and even dirty
enough to kill."
Historical Precedent. Governments appear to have
sponsored the interpretation of severe flu epidemics with industrial bias.
London Smog Coverup
The Great London Smog Coverup, described by Paul Brown, Environmental
editor for the UK Guardian10:
To cover up the true extent of the smog
disaster the government invented a [viral] influenza epidemic. In fact
research has shown there was no epidemic and that the thousands more people
who continued to die for the next four months did so because of the air
pollution. ... Devra Davis, honorary professor at the London School of
Hygiene and Tropical Medicine ... blames Harold Macmillan, then minister for
housing, for suppressing the truth about dirty coal. A later claim by the
Ministry of Health that 5,655 had died of [viral] influenza in the first
three months of 1953 was a fabrication to hide the smog deaths. ...
Tim Williamson (National Society for Clean Air)
then draws the parallel to the contemporary petrochemical industry and its
mobile exhaust outlets, motor vehicles: "Now there are 28m vehicles, 85% of them
cars. ... We have defeated one problem only to create another, and [this
government] has yet to come to terms with the problem."
Heat Wave Epidemics
Causation for seasonal, summer mortality is often advertised as "heat
waves" in cities like Pittsburg, Chicago, and New York. Meanwhile temperatures
can be 30∞ higher in Phoenix without any "heat wave" mortality.
In 2003, a great heat wave epidemic struck Europe, mostly in France. Causation
was advertised widely as a heat wave. Much later, brief press releases mentioned
that some scientists believed that this epidemic was due to air pollution. For
example, on Sept. 1, 2003: "PARIS (Reuters) ñ Air pollution may have been the
cause of death for thousands of French people who died in a heat wave that
struck Europe this August, an environmental official said. ..."
SARS
Severe Acute Respiratory Syndrome (SARS) has obvious toxicological
factors, with its biggest epicenters being downwind from major industrial
regions. Hong Kong was a major SARS epicenter, downwind from China's Guangdong
industrial region. Of Hong Kong's 11 districts, the highest incidence of SARS
was found in the district with the highest air pollution. The most intense
epidemic occurred in the Amoy Gardens, a high-rise apartment complex. Strangely,
most of the cases occurred at floor 10 and above, indicating vulnerability to
stratified industrial smokestack pollution. As of a 2002 study, 40% of Hong Kong
children suffer respiratory disease; thus, SARS appears to be a new name related
to an old ailment. Six months after my SARS study was published by the Weston A.
Price Foundation, a study was published by UCLA indicating a high correlation of
SARS mortality with air pollution. SARS then left the panic scene, replaced by
"Bird Flu."
New York Avian Mortality
It appears that the "flu-like" West Nile virus epidemics are
interpreted with industrial bias.11 In the New York
City region, avian mortality reached record high in the years following
increases in MTBE concentrations in gasoline in 1994. MTBE is a highly
poisonous, unpublicized chemical, mandated into gasoline since at least the
mid-1970s, as an oxygenate, purportedly ñ and disputably ñ to reduce air
pollution. MTBE intensifies the existing toxic characteristics of engine
exhausts, increasing levels of methyl nitrite and formaldehyde.
The ban on MTBE was initiated by the EPA (Environmental Protection Agency) on
July 27, 1999. That coincided with the apex of the first declared West Nile
virus epidemic in the US. This flu-like disease, potentially fatal, is often
diagnosed as meningitis and encephalitis. Preceding the human epidemic were
findings of dead crows along expressways and bridge outlets.
Initially, the New York State Department of
Environmental Conservation (NYSDEC) actually blamed the 1999 avian
epidemic on unspecified industrial pollution. About a month after a human
epidemic was discovered, the CDC and local New York City Department of Health (NYCDOH)
announced a virus epidemic through Mayor Rudolph Giuliani, September 3, 1999.
This was highly dramatized in the media with a military-style attack on "the
virus," using helicopters to spray the entire Tri-State Region with the
organophosphate pesticide malathion. Four of the five boroughs were sprayed,
though not Manhattan, which was fogged by truck. All the while, headlines
blared, "The Deadly Virus." With this overpowering politic, the NYSDEC reversed
its presumptive toxicological diagnoses, embraced the virus paradigm, and
received funding for virus diagnostics of wildlife.
The geographic epicenter location in 1999 is the same as the swine flu epicenter
location for 2009; that is, Flushing Meadows, Queens, New York City.
Swine Flu: Symptoms correlate well with
environmental causation, yet the diagnostics lack toxicology. To argue for
toxicological diagnostics, environmental factors are presented for US swine flu
epidemics, as reported by the media and NYCDOH, beginning late April 2009.
Epicenter 1: St. Francis Prep
School
This school epidemic led the swine flu media furor which began in
April 2009. This epidemic event represents the highest incidence worldwide for
swine flu. The location of this school is Flushing Meadows.
Incidence of flu symptoms spiked on April 23 at St. Francis School (see
satellite photo).12 Five days later, the school was
closed by the NYCDOH. One-third of students polled responded that they had
experienced flu symptoms, and many cases were confirmed by the CDC as swine flu.
In New York City, there is a tradition of official
concern about air pollution, because, for instance, one-fourth of New York City
school children have asthma, a disease related to air pollution and, as some
researchers have found, neuropathologies. This might explain why, in New York
City, it is illegal to idle an engine for more than 60 seconds near a school.13
In the vicinity of St. Francis Prep, engines do much more than idle.
Eighteen lanes of traffic are adjacent St. Francis: Long Island Expressway,
Horace Harding Expressway, and Francis Lewis Blvd. If nearby traffic loops and
the Clearview Expressway, 1,000 feet to the east, are included, then the total
vicinity traffic is at least 30 lanes. These lanes extend as straight lines for
miles.
It is important to understand the danger of long,
straight lanes. A slow unidirectional wind in line with these straight traffic
structures can target any nearby school or residence with high concentrations of
vehicular exhaust as wind drifts through the lanes, accumulating and raising
toxic concentrations. This scenario is more dangerous during rush hour or
pre-sunrise hours when winds can slow and temperature inversions tend to occur.
Note: in this commentary, SUIR stands for Slow,
Unidirectional wind, In-line with Rush-hour traffic. This is not an
established acronym, but to avoid repetition it is necessary, as a convenient
designation for what is an apparently novel concept. Despite its novelty, it is
common sense and common experience. For further clarification, see drawing
"In-line Worst Case Scenario."
Another, more conventional air hazard scenario is where slow wind predominantly
crosses the traffic lanes at a 90 degree right angle. See "Crosswind Scenario."
The cross-wind scenario is much less hazardous than
the SUIR scenario.
Traditional freeway and expressway air pollution studies generally conclude that
after 300 to 500 yards, levels subside to background levels. New studies,
however, find this distance to be as much as 1.5 miles during pre-sunrise hours,
because of slow winds and temperature inversions that prevail.14
Area Pollution
St. Francis is also exposed to a major airport, La Guardia Airport (LGA),
one of the nation's busiest, situated 5 miles northwest, up the prevailing wind.
The airport's main takeoff lane is directly in line with this school. Airliner
turbines drive exhaust downward, mixing with ground-level air to an extent
influenced by factors such as air temperature, convection efficiency, wind
direction, and speed. One airliner during takeoff and landing is equivalent to a
car driving approximately 5,600 miles, in terms of exhaust pollution.15
See map "LGA."
Approximately 19 tons of NOx (toxic nitrogen
compounds) per day are produced from La Guardia air traffic, accounting for 1%
of New York City's total NOx production. Though LGA is miles away, its airliners
can affect ground level until they reach approximately 3,000 feet altitude.
Prevailing winds are northwest, thus moving a continuous expanse of LGA
pollution across Queens.16 Regionally, 70% of US
air carrier aircraft travels through the New York City airspace, including
Newark Airport, New Jersey.17
St. Francis: A Ballpark
Study
Pollution data are not available in the immediate vicinity of St.
Francis. There is no comprehensive air monitoring system on site. Regional and
area data are available; for example, EPA ozone maps, weather data, and general
studies of symptoms and dosage observations. These are valuable data sources yet
not sufficient to understand the toxicological plight of St. Francis.
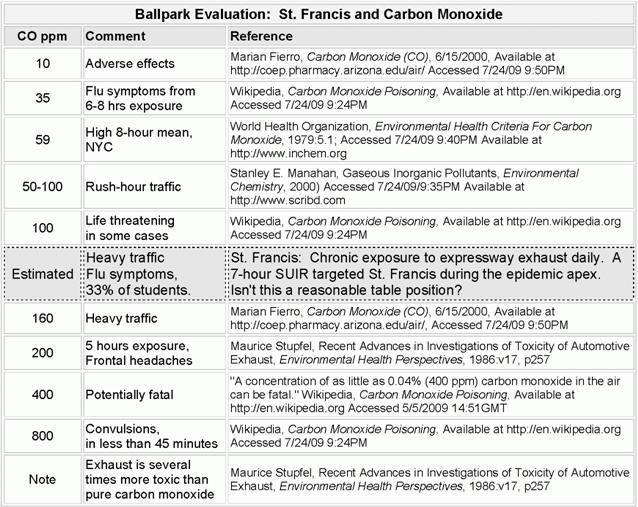
It is possible, using CO literature, to compare dosage and effects of the CO
component of vehicular exhaust. This comparison places St. Francis within the
hazard ballpark. See table, "Ballpark Evaluation."
Stressors Summed
Disease can be conceptualized as symptoms resulting from the sum of
stressors and stressor synergies. Air pollution stressors behave as constants
and variables. They can be categorized as global, regional, local, adjacent, or
internal to a building. Global, regional pollution is slow-changing, and
relatively constant. Local and immediate pollution can be more variable. Airport
pollution is a relative constant burden, though dependent on wind
characteristics. Expressways are a local variable, always an extreme potential
hazard, and variable exposures are dependent upon wind direction and speed. Air
temperature inversions are a variable.
Random Stressors
Random, short-term air pollution attacks on a specific location are
beyond the ability of EPA to publicly predict. Numerous constant and variable
stressors can coincide at a specific location to create a disastrous sum of
toxic stress, resulting in disease. The NYDEC, NYDOH, and CDC are aware of
stressor probabilities for high-risk zones, because they run detailed models,
taking days of computer time to determine worst-case scenarios. That could
explain why expressway speed limits in the New York City area are mysteriously
limited to 55 mph, though originally designed for 75 mph traffic. Thousands of
people reside, study, work, and are transported near or within expressways. The
slower speeds cut the volume of exhaust emissions in half, lessening the
regularity of occurrence for the more obvious epidemics.
Local weather, as a random coincidence of hazardous
variables, is of the greatest importance. Such variables can change per minute
or per second, from benign to acute ñ benign if the wind is blowing away from
the target, and acute during a perfect SUIR. Basically, there are four weather
factors that contribute to a SUIR.
Wind speed: Slow.
Wind direction: In-line with adjacent LIE expressway traffic (not
merely cross-wind). Unwavering, unidirectional, source to target. A highly
directional plume.
Temperature inversion: Usually, warm exhausts move upward via convection into
cooler upper layers. During an inversion, air strata temperatures are reversed,
with warmer layers on top of cooler layers at ground level. Exhaust moves up
through the lower cool layers, absorbing that coolness, and then upon
encountering an upper (but low level) warm strata, convection is halted. The
phenomena depends on other factors such as turbulence and layer location and
structure. Inversions are common in pre-sunrise hours.
Warm seasonal air temperatures: This can lower the efficiency for upward
convection of warm exhausts.
April 23, 2009: Epidemic Apex
The epidemic apex at St. Francis began on April 23, as many students
began lining up outside the nurse's office at approximately 9:30 a.m. They
continued to line up throughout the rest of the day. A total of 102 students
were sent home that day. This was very unusual, prompting the school nurse to
call the NYCDOH at 10:30 a.m.
Two excerpts from CBS News18:
"More than 100 students at St. Francis
Preparatory School in Queens were suddenly hit with fever, sore throat and
other aches and pains.
"'I just saw lot a lot of kids lined up along the wall near the nurse's
office," sophomore Kelsey Dittmeir said.'"
The New York Times,
April 28, 2009: "By 10 a.m., dozens of students were pouring into the hallway
outside her office, sitting miserably on the floor, nauseous and confused." The
nurse called Dr. Gary Krigsman, who referred her to the CDC's Ada Santiago. One
hundred and two students were sent home by the nurse on Thursday, and 80 on
Friday.19
With such suddenness, questions must be asked: Is this a replicating virus,
spreading upon contact from a few people (6 of over 2,500 students) who returned
with an assumed infection from Mexico? Or is this a sudden increase in air
poisoning? Students suddenly became ill at school during an unusual period of
intense air pollution specific to the school. Why did the NYCDOH narrowly assume
the virus paradigm?
Environmental studies provide alternative answers.
Wind Vector Study
Coinciding with the epidemic apex is a set of unusual wind patterns,
bringing high concentrations of expressway pollution to bear on St. Francis, as
a SUIR scenario for 12 unrelenting hours.
Wind patterns for the epidemic apex (April 23) have been studied in detail with
Wvect software.20 See satellite photo "Wind
Patterns 3ñ4 a.m.," where, for clarity, only wind patterns passing through St.
Francis are designated.21 This reveals a dramatic
steady focus of expressway pollution into the school, saturating its structure
before school hours, and throughout the school day, from 12am to 12pm.
Wind Patterns 3ñ4 a.m.
Satellite View
Such wind patterns continued for 12 hours, from 12am through the school morning.
For example, see satellite photo, "Wvect 4/23 3ñ4:00am," with winds from the
northwest.
Wind Patterns 8ñ9 a.m.:
Satellite View
By 9 a.m., the classes had been in session for 70 minutes. Wind
patterns are shown for the period 8ñ9 a.m. These wind patterns continue into the
afternoon, with some increasing dispersion after 11am. See satellite photo, "Wvect
4/23 8ñ9:00am," with winds from the northwest.
Wind Before vs. During
April 22 vs. April 23
The DAY BEFORE THE EPIDEMIC APEX (Wednesday, 4/22), few wind patterns cross
traffic lanes towards St. Francis. There also are no usual number of visits to
the nurse's office.
Compare the two traffic maps for St. Francis, "Wind Pattern Study, April 22nd"
and "Wind Pattern Study, April 23rd" and note the wind pattern differences.
Note that on the DAY OF THE EPIDEMIC APEX (Thursday, 4/23), all wind patterns
cross traffic lanes towards St. Francis, usually as a perfect SUIR.
NYCDOH Bar Graph22
A Classic Epidemic
The NYCDOH produced a bar graph, "Date Of Illness Onset Of St.
Francis Students," by polling students, asking for dates of perceived flu
symptoms. The poll was finalized six days after the epidemic breakout. The
NYCDOH compiled the poll in the midst of dramatic media publicity.
This graph fits the publicized image of six virus-infected students returning
from Mexico on April 20, after spring break. See the bar graph "Date of Illness
Onset."
The NYCDOH's data-gathering and evaluation were
highly subjective. The symptoms reported by students after April 23 can be
reasonably expected, due to fear induced from massive media hype, which occurred
after the 23rd. Residual symptoms from that date would also be perceived as more
serious due to the media hype. Students would be encouraged by parents to claim
symptoms to avoid class as a precaution against supposed virus infection. The
presence of the questionnaire itself is a bias factor.
The NYCDOH chose not to use objective data, recorded at the nurse's office.
Prior to April 23, the nurse had recorded data without presumptions, without
knowledge of the impending epidemic. Her records resolve the contradictions
established by the NYCDOH's bar graph and the wind vector studies.
The nurse was interviewed to discover actual visits and activity at her office,
recorded before, during, and after the epidemic apex.
Nurse Interview
Critical data acquired during the nurse interview confirm the wind
studies and contradict the NYCDOH graph.23 The
nurse stated that there were absolutely no unusual number of visits to her
office, no unusual activity, in the week prior to the April 23 outbreak; that
is, since April 20, when the six students returned from Mexico.
She also stated that, to the best of her knowledge, there was no environmental
testing on or after the 23rd, regarding, for example, ventilation system,
painting, floor surfacing, expressway, or gases. When asked if the omission of
environmental studies was "because the epidemic was viral?" she replied, "Yes."
The nurse gave counts for students sent home on April 23 and 24, which confirmed
counts already public information. She speculated as to why her records prior to
April 23 did not conform to the NYCDOH poll, stating that symptoms may have been
too low level for students to visit her office. See "NYCDOH Graph Comparison."
The NYCDOH's graph dramatizes the virus theory by
showing a classic logarithmic rise in number of flu symptoms beginning on April
20, when the six students returned from Mexico vacation, presumably infected.
Further information was requested from the nurse's
office. No response. The NYCDOH is known to keep a tight rein on communications.24
NYCDOH Questioned
To understand toxicological avoidance, I posed a simple question on
the NYCDOH Swine Flu Forum (June 24, 2009).25 This
forum was managed by Dr. Susan Kansagra, who "worked on the Health Department
team that's responding to this outbreak."
Question: "Is the flu investigation team reviewing air pollution at the closed
schools?"
Dr. Kansagra replied, unusually off-topic, "Like all flu viruses, H1N1 virus is
spread mainly through respiratory droplets when an infected person coughs or
sneezes."
The question was repeated. The forum was closed.
Usually, questions were answered within 20 minutes to three hours. In this case,
Kansagra's off-topic reply and forum shutdown arrived two days later. The
original question had been passed up in favor of answering others, until the
off-topic reply.
The closing of forums is not unusual, along with censure, bans, top-down
declarations of "fact," and ad hominem arguments.
AIRNow Pollution Maps and
Spring Break
I had noticed there were few symptoms reported by the NYCDOH poll
during the second and third week of April, yet area pollution readings were high
according to the averaged AQI levels shown by EPA AIRnow maps. To understand
this contradiction, I referenced the New York Department of Education and found
that there was no spring break at that time. This was puzzling. Later, I found
that St. Francis, being a Catholic school, was not following the New York City
calendar, and had indeed been on spring break, thus conforming to the air
pollution theory.
Related Case
Details of this case need confirmation, because it concerns an
individual, where data is difficult to obtain and difficult to describe due to
privacy ethics. Years ago, a rare case of flu, severe enough to be highly
publicized (though with scant detail), occurred in the New York City region. At
that time, I had noted this case for future study. While gathering data for this
current paper, I found that the victim was hospitalized while apparently
attending St. Francis Prep during a SUIR, with diagnostics and antibiotic
treatments immediately preceding an severe acute disease episode. This victim
was already mildly ill and possibly already undergoing pharmaceutical treatment
when the acute symptoms suddenly appeared.
Epicenter 2: Rye School
(Westchester, New York)
This school was reported secondly in the New York regional media, and
nationally this epidemic vied for attention with the emerging Texas swine flu
news. See photo-map "Rye School."
Only four cases were confirmed as swine flu. The school was scheduled to close
on May 5, 2009, apparently because administrators were influenced by the heavy
St. Francis publicity and because one Rye School student had the week before
arrived from a visit to Mexico and became ill with mild flu symptoms on April
27, 2009.
On that day the wind was from the two expressways. The average wind speed was
very slow, one of the slowest of the month, averaging 2.7 mph during the school
hours.
A wind plume map has been depicted as a series of wind vectors from the school.
This reveals a SUIR, though not as unwaveringly focused, nor as close to the
pollution sources, as the St. Francis SUIR. Accordingly, there were not as many
cases of flu symptoms during the period circa April 27. See photo-map "Rye
School : Wind Direction Vectors."
Epicenter 3: Deer Park Schools
JFK Intermediate School, in Deer Park, Long Island, New York; five
cases suspected swine flu (marked "A"). Deer Park Union Free School, in Deer
Park, just south of JFK Intermediate School. 3 cases suspected swine flu. Closed
May 3, 2009
These schools are not adjacent to expressway traffic. However, seven expressways
lie as a perimeter around the schools at 2 to 3 miles' distance. These could not
easily account for a sudden onset of flu symptoms. A contradiction looms.
Assuming expressway pollution at this distance is a somewhat constant low-level
exposure, and assuming virus = biomarker for poisoning, then further study
resolves contradictions, finding a source of air pollution approximately 200
feet east of the school border; that is, a major Superfund site and ongoing
industry. Contaminants include, for example, chlorines, xylenes, and benzenes.
During prior years, 50,000 tons of soil was "remediated," which means toxins
discharged to the atmosphere. Current status of operation is difficult to
determine but it appears that clean-up operations are now minimal.
The EPA lists only one of these Superfund sites as possibly active, SMS
Instruments Inc.
EPA Site Description: "SMS Instruments, Inc. is
located in a light industrial area in Deer Park. The site consists of a
one-story 34,000-square-foot masonry building on 1-1/2 acres. Approximately 80%
of the lot is paved with asphalt. From 1971 to 1983, SMS Instruments, Inc.
overhauled military aircraft components. Industrial wastes generated from
degreasing and other refurbishing operations were discharged to a leaching pool
on site. In addition to the leaching pool, other sources of contamination
included a 6,000-gallon underground storage tank used for jet fuel storage and
corroded and leaking drums stored outdoors in an unprotected area. More than 50
industrial facilities are located within a 1-mile radius of the site, and a
large groundwater recharge basin is located adjacent to the eastern side of the
site."26
Discussion
Other school epidemics have been reviewed with similar findings that
argue for toxicological diagnostics. The supposed global epicenter at La Gloria,
Mexico, was also reviewed and found to have obvious toxicological factors. With
every review of any epidemic or case, findings vary; that is, toxicological
modes and events vary, yet there is an ease with which data sensibly fall into
place. The toxicological argument is slowed by data blockage and Orwellian
definitions; otherwise, the toxicological argument always benefits from more
data.
The toxicological approach sets the foundation for a general toxicological
theory of disease where Occam's razor thrives. Patients as well as medical
people are encouraged to demand environmental reviews as essential protocol, and
to look skeptically at any paradigm that does not include a full toxicological
review. All diagnostics should be moot unless pollution and pharmaceuticals are
fully discounted.
Disease symptoms themselves are freely available indicators of environmental
hazards, and they have no conflict of interest with chemical industries. They
are the ultimate indicators. Relevant new ideas and information often arrive by
focusing on the possibilities of air pollution as revealed by timeline analyses
of symptoms. A tremendous variety of symptoms, too many to list here, can be
bioindicators of low-level, chronic air poisoning, or brief acute poisoning,
which are below the threshold of technical detection, or out of the scope of
politicized technical detection. The symptom is the bottom line. This informal
toxicology can be confused and complicated by nutritional ignorance,
chlorinated-fluorinated water, pesticides, pharmaceuticals, cigarettes,
caffeine, and alcohol. Fewer toxicological variables means simpler and more
successful diagnostics.
One could argue forever about germs and whether they are symbionts or pathogens.
It is most effective to simply leave the burden of proof where it belongs, on
those who claim germ causation. They must be routinely confronted with the
simple position that all claims for germ pathology are moot until toxicology is
discounted. A single question is challenging enough: "Why is toxicology
omitted?" Many areas of medical expertise can be effectively challenged with
that question; for example, microbiology, diagnostics, and epidemiology.
The process of selecting schools for this study was unbiased. The first three
school swine flu epicenters announced by mainstream media in 2009 were studied.
Many other schools in the New York City area have also been studied.
These studies are based on previous work: Polio and
Pesticides (1997), West Nile Virus Epidemics and Air Pollution (1999), SARS and
Air Pollution (2001), Bird Flu and Air Pollution (2004), and discussions with
NoSpray Coalition, NYC.27-32
For guidance, editorial support, and technical contributions, many thanks to
Sheri Nakken, Gary Krasner, Ramiel Nagel, and John Scudamore.33-36
The intent of this commentary is literary, critical, and academic, for
discussion. An ethical medical professional should be consulted regarding
medical issues.

©HARpub 2009, Jim West ñ All Rights Reserved
Jim West served as chairman of the Science
Committee for NoSpray Coalition, which successfully litigated (2000ñ2007)
against the Giuliani administration (NYC) regarding pesticide spray campaigns.
He is a member of GreenSpeakers, Toastmasters, and ARAS (Canada). He studied
mechanical and chemical engineering at ASU, and has resided in New York City for
the past three decades. Contact information:
harpub@hotmail.com.
Notes
1. Regush, N. Virus or environment.
ABC News. Aug. 29, 2001.
http://abcnews.go.com/Health/story?id=117258&page=1. Accessed Dec. 7, 2009.
2. Carbon monoxide poisoning [web page]. Wikipedia.
http://en.wikipedia.org/wiki/Carbon_monoxide_poisoning. Wikipedia. Accessed
July 20, 2009.
3. Krivoshto et al. The toxicity of diesel exhaust: implications
for primary care. J Am Board Fam Med.
2008;21(1):55ñ62. Available at:
http://www.jabfm.org/cgi/content/full/21/1/55. Relevant extracts: "Diesel
exhaust is 100 times more toxic than gasoline exhaust, even when carbon monoxide
is considered" and "gasoline exhaust, which contains 28 times more carbon
monoxide than diesel exhaust." Accessed Dec. 7, 2009.
4. Gabrielse D. Play it safe with engines.
Occup Health Saf.
http://ohsonline.com/Articles/2009/01/01/Safe-with-Engines.aspx, Accessed
July 20, 2009.
5. Carbon monoxide poisoning [web page]. Maimonides Medical
Center. Available at:
https://www.maimonidesmed.org, Accessed July 20, 2009.
6. Carbon monoxide poisoning. Wikipedia.Op. cit.
7. Diesel exhaust particulates reasonably anticipated to be a
human carcinogen. In: National Toxicology Program. Department of Health and
Human Services. Ninth Report on Carcinogens.
2000. Available at:
http://ntp.niehs.nih.gov/ntp/roc/eleventh/profiles/s069dies.pdf. Accessed
Dec. 8, 2009.
8. Dolan MC, Haltom TL, Barrows GH, Short CS, Ferriell KM.
Carboxyhemoglobin levels in patients with flu-like symptoms.
Ann Emerg Med. 1987;16 ISS7:752ñ756.
9. Sadovnikoff N, Varon J, Sternbach GL. Carbon monoxide
poisoning. An occult epidemic. Postgrad Med.
1992;4:15;86ñ88,92ñ96.
10. Brown P. 50 years after the great smog, a new killer
arises. Guardian. Nov. 30, 2002. Accessed July
18, 2009.
11. West J. West Nile virus positives and MTBE.
Townsend Lett. 2002;228:64ñ76.
12. Google Maps online: All satellite photos and maps.
13. Council of the City of New York. Council votes to toughen
engine idling restrictions near city schools. PR005-2009. Jan. 28, 2009.
14. Hu S. A wide area of air pollutant impact downwind of a
freeway during pre-sunrise hours. Atmos Environ.
2009;43:2541ñ2549.
15. Transportation facts [Web page]. Coalition for Clean Air.
http://www.coalitionforcleanair.org/our-programs-transportation-facts.html.
Accessed July 20, 2009.
16. West J. Geography: toxicology and WNV encephalitis.
http://www.harpub.co.cc/noxot/epidGeog.htm. Accessed July 20, 2009.
17. House Transportation and Infrastructure Subcommittee on
Aviation. Statement by Louise E. Maillett, Acting Assistant Administrator for
Policy, Planning And International Aviation, Federal Aviation Administration,
Department of Transportation. Dec. 5, 2000. Available at:
http://testimony.ost.dot.gov/test/pasttest/00test/Maillett2.htm. Accessed
Aug. 1, 2009.
18. Carlin D. Confirmed: swine flu outbreak at Queens school
[Web article]. CBS Broadcasting. April 29, 2009.
http://wcbstv.com/health/swine.flu.nyc.2.994071.html. Accessed December 7,
2009.
19. Hartocollis A. School nurse's response to flu wins
applause. New York Times. April 28, 2009.
20. Wvect software, engineered by MaguSoft.
21. All maps are Google Maps:
http://maps.google.com.
22. New York City Department of Health and Mental Hygiene. St.
Francis Prep update: swine flu outbreak: Survey Monkey results. Available at:
www.nyc.gov/html/doh/downloads/pdf/cd/h1n1_stfrancis_survey.pdf. Accessed
Oct. 3, 2009.
23. Harvey E. Interview of Nurse Mary Pappas, of St. Francis
Prep. Sept. 18, 2009. Transcription.
24. In 2001, Nicholas Regush of ABC News attempted to contact
NYCDOH regarding air pollution and West Nile virus epidemics. The press office
interrogated him at such length that he told them, "I'm supposed to be
interviewing you, not the other way around!" NYCDOH did not respond for
interviews. Personal communication.
25. Kansagra S. H1N1 flu. nycHealthy [blog].
http://pulse.typepad.com/nychealthy/2009/05/dr-susan-kansagra-h1n1-flu.html.
Accessed July 20, 2009.
26. SMS Instruments. EPA Region 2 [online document]. Available
at:
http://www.epa.gov/region2/superfund/npl/0201325c.pdf. Accessed Jan. 4,
2009.
27. West J. DDT/Polio. New
York; HARpub; 1997
28. West J. Images of poliomyelitis ñ a critique of scientific
literature. Townsend Lett. 2000;203:68ñ75.
29. West J. West Nile Virus positives and MTBE.
Townsend Lett. 2002;228:64ñ76.
30. West J. The SARS epidemic: are viruses taking the rap for
industrial poisons? Wise Traditions. Dec. 7,
2003. Available at:
www.westonaprice.org/envtoxins/sarsepidemic.html.
31. Rappoport J. Has Jim West turned conventional knowledge
about bird flu upside down? No More Fake News [blog].
http://www.nomorefakenews.com/archives/archiveview.php?key=2961. Accessed
Dec. 7, 2009.
32. NoSpray Coalition.
http://nospray.org. Coordinator, Mitchel Cohen, chairman of the NYC WBAI
board.
33. Sheri Nakken, RN; director, Vaccination Information &
Choice Network:
http://www.wellwithin1.com/vaccine.htm.
34. Gary Krasner, director of Coalition For Informed Choice (CFIC),
Queens, NY: http://www.cfic.us.
35. Rami Nagel, author, researcher, consultant on medical
alternatives:
http://www.healingourchildren.net.
36. John Scudamore, curator of an online collection of medical
investigations:
http://www.whale.to.