[back] Book: VACCINATION A DELUSION by ALFRED RUSSEL WALLACE (split into chapters)
GRAPH
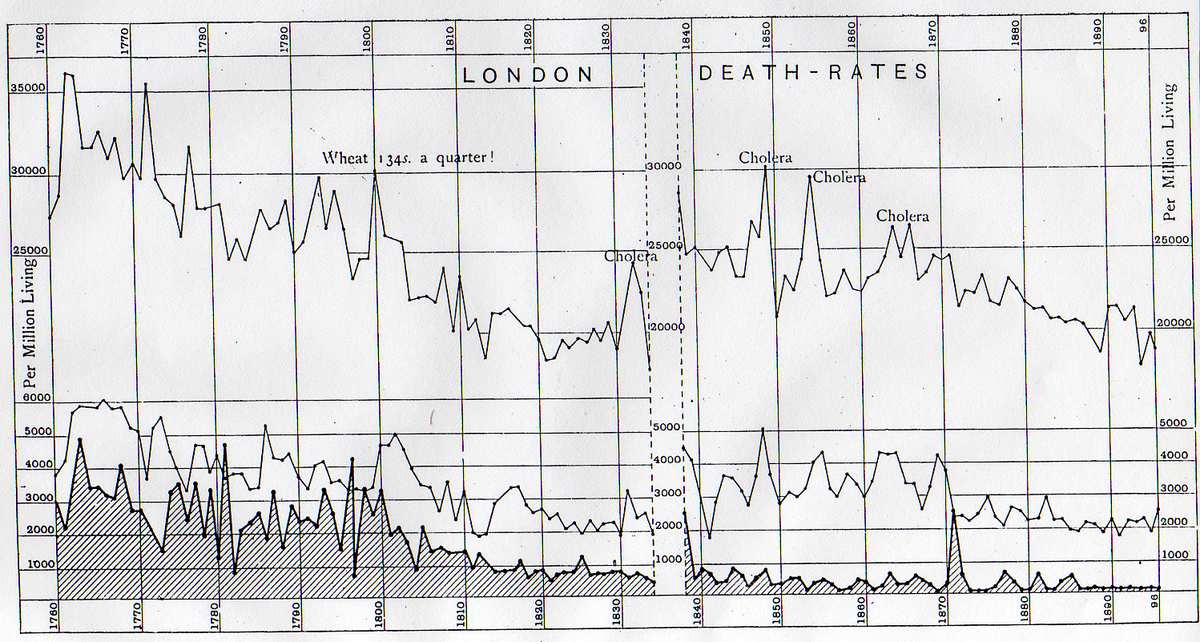
1.
London Death-rates per
Million Living from 1760 to 1896.
The Upper line shows rates of Death, from All Causes.
The Middle line shows rates of Death from Zymotic Diseases, including Measles,
Fevers, Whooping-cough, and Diphtheria.
The Lower line (shaded for distinctness), SmallŁpox.
The blank four years, 1834-8, are omitted because they are the last of the
old "Bills of Mortality," and are considered to be very imperfect.
From 1838 onwards is the period of complete Registration.
Each ten years is indicated at the bottom and top of the diagram.
The figures at the sides and centre show the mortality per million.
The Upper line (total mortality) is on a smaller vertical scale, and is brought
lower down to allow of its being included in the diagram.
Authorities.
The lines in the diagram from 1760 to 1834 are
calculated, from the figures given in the Second Report, pp. 289-91, with those
for other diseases from Dr. Creighton's
History of Epidemics in Britain ; the population at
the different periods being taken from the best
available sources (Maitland, and the 8th Report of the
Registrar-General). The later portion is entirely from
the Reports of the Registrar-General.
[back] CHAPTER 6: SUMMARY AND CONCLUSION Graph I. exhibits the most extensive body of national statistics available, showing at one view the death-rates from Small-pox, from the other chief Zymotic Diseases, and the Total Mortality, from 1760 to 1896. The first portion, from 1760 to 1836, is from the "Bills of Mortality," which, though not complete, are admitted to be, on the whole, fairly accurate as regards the variations at different periods and between different diseases. The second part, from 1838 onwards, is from the Reports of the Registrar-General, and is more complete in giving all deaths whatever. Its lines are, therefore, as it were, on a higher level than those of the earlier period, and can only be compared with it as regards proportions of the different mortalities, not so accurately as to their total amounts. The main teaching of this graph—a teaching which the Commissioners have altogether missed by never referring to graphs showing comparative mortalities—is the striking correspondence in average rise and fall of the death-rates of small-pox, of zymotics, and of all diseases together. This correspondence is maintained throughout the whole of the first part, as well as through the whole of the second part, of the graph; and it proves that small-pox obeys, and always has obeyed, the same law of subservience to general sanitary conditions as the other great groups of allied diseases and the general mortality. Looking at this most instructive graph, we see at once the absurdity of the claim that the diminution of small-pox in the first quarter of our century was due to the partial and imperfect vaccination of that period. Equally absurd is the allegation that its stationary character from 1842 to 1872, culminating in a huge epidemic, was due to the vaccination then prevailing, though much larger than ever before, not being quite universal—an allegation completely disproved by the fact that the other zymotics as a whole, as well as the general mortality, exhibited strikingly similar decreases followed by equally marked periods of average uniformity or slight increase, to be again followed by a marked decrease. There is here no indication whatever of vaccination having produced the slightest effect on small-pox mortality.
The second graph shows that, even taking the Commission’s favourite method of comparing the zymotics separately with small-pox, all of them except measles show a similar or a greater decrease during the period of official registration, and also agree in the periods of slight increase, again proving the action of the same general causes (which I have pointed out at p. 37), and leaving no room whatever for the supposed effects of vaccination.