[back] Book: VACCINATION A DELUSION by ALFRED RUSSEL WALLACE (split into chapters)
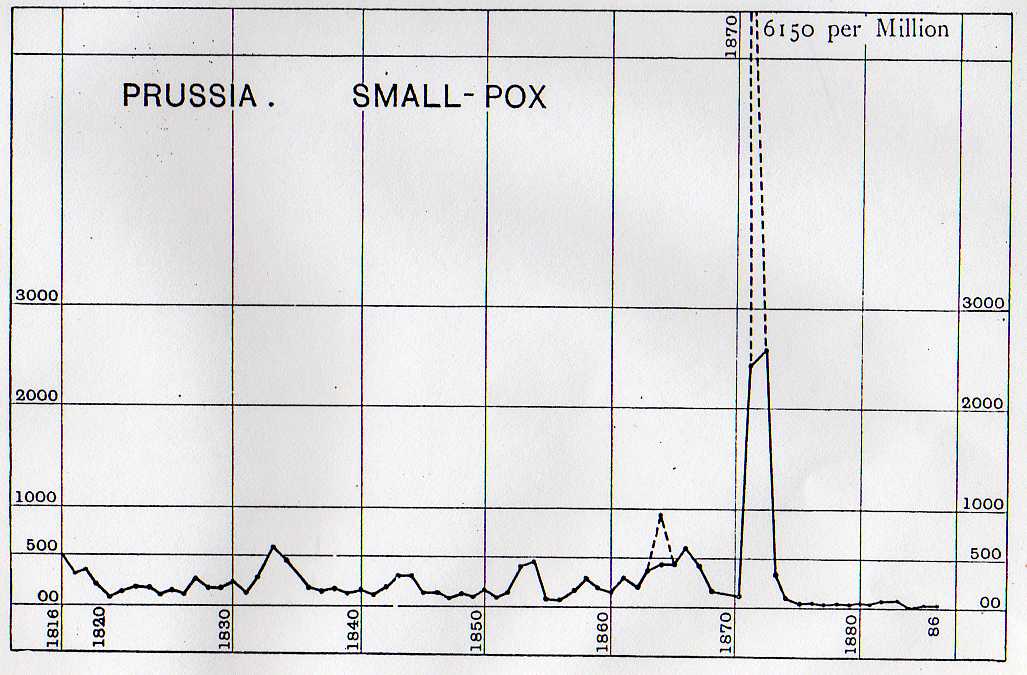
Small-pox death-rates in Prussia
---solid line
Epidemics in Berlin---------------- dotted line
From the figures appended to the diagram opposite p. 232 of the Second Report, and the Berlin epidemics from the table at p. 231 of the same Report.
[back] CHAPTER 6: SUMMARY AND CONCLUSION The next three Graphs, 5., 6., and 7., show small-pox mortality in Sweden, Prussia, and Bavaria— countries which at previous enquiries were adduced as striking examples of the value of vaccination. They all show phenomena of the same character as our own country, but far worse as regards epidemics in the capitals; that of Stockholm, in 1874, causing a death-rate more than 50 per cent. higher than during the worst epidemic of the last century in London! The graph of small-pox and zymotics in Bavaria is given merely because the statistics were brought before the Commission as a proof of the beneficial results of vaccination in well vaccinated communities. It was alleged by Dr. Hopkirk that almost the whole of the population were vaccinated, and admitted by him that of the 30,742 cases of smallpox in 1871 no less than 95.7 per cent. were vaccinated! The epidemic was, however, less severe than in Prussia, again showing the influence of density of population less than one seventh of the Bavarians inhabiting towns of over 20,000, while one-fourth inhabit similar towns in Prussia; but we see that during the latter half of the period chosen small-pox greatly increased, and the other zymotics remained very high, indicating general insanitary conditions. And this case was specially brought before the Commission as a proof of the benefits of vaccination! In their Final Report the Commissioners omit to point out that it really indicates the very reverse.