Deaths of Children Under 15 Years (England & Wales)
Shows that in England and Wales there was a 90 percent decline in child mortality from the combined infectious diseases of scarlet fever, diptheria, whooping cough, and measles in the period of 1850 to 1940. The first vaccine made available was for Diptheria in the early 40's, whereas the pertussis (whooping cough) vaccine became available in the early 50's and the measles vaccine in the late 60's (no vaccine was provided for scarlet fever). Sourced
Whooping Cough (England & Wales)
Indicates that in England and Wales the annual death rate of children (under age 15) from whooping cough declined by roughly 98.5 percent in the period covering 1868 to 1953, after which the pertussis vaccine became generally available Sourced
Measles (England & Wales)
shows that in England and Wales the annual death rate of children (under age 15) from measles declined from over 1,100 per million in the mid-nineteenth century, to a level of virtually 0, by the mid 1960's Sourced
Measles (England & Wales)
shows that in England and Wales the annual death rate of children (under age 15) from measles declined from over 1,100 per million in the mid-neneteenth century, to a level of virtually 0, by the mid 1960's Sourced
Infant Mortality Rate (Australia)
Indicates that in Australia, approximately two thirds of the total decline in infant deaths from all childhood infectious diseases, in the period covering 1881 to 1971, occurred before the introduction of mass immunization efforts Sourced
Declining Death Rates (US)
reveals that in the United States--without benefit of any vaccine--the tuberculosis mortality rate underwent a drop of roughly 96 percent in the first 60 years of this century; and that in a little short of the same time span (although the effectiveness of the vaccine has been seriously questioned by reputed scientists) mortality from typhoid vanished.60 Sourced
Declining Death Rates (England)
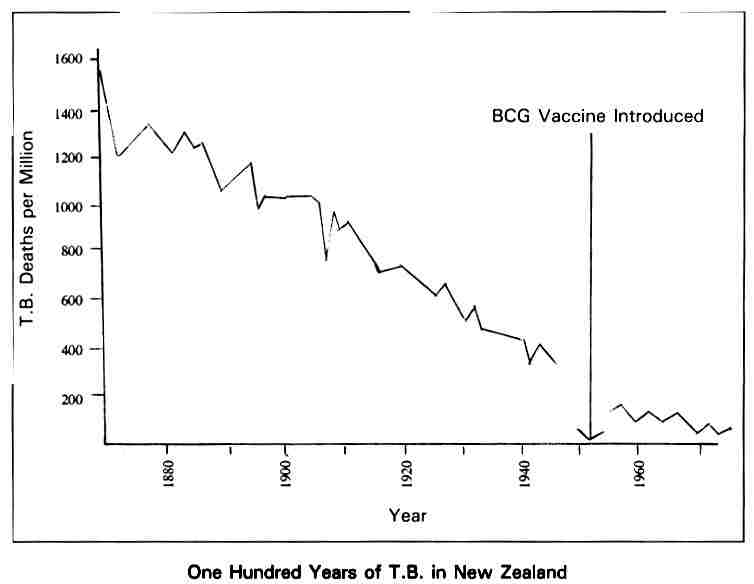
shows that in England death rates from respiratory tuberculosis underwent a roughly 87 percent decline in the period beginning 1855 and ending in 1947, when antibiotics first came into wide use; and a further decline approximating 93 percent by 1953, preceedin the introduction of the BCG vaccine.61 Sourced
Acute Rheumatic Fever Death Rates (Britain)
indicates that in Britain, the annual death rate from rheumatic fever underwent a decline approximating 86 percent in the period covering 1850 to 1946, before penicillin had become available.63 Sourced
Scarlet Fever Death Rate (England & Wales)
reveals that in the period of 1865 to 1935, before sulfonamides had become available in England and Wales, the annual death rate from scarlet fever declined by approximately 96 percent.64Sourced
Diphtheria (Nigeria)
shows that following a significant increase in the diptheria morbidity rate which Peaked in 1977, the disease underwent two years of rapid natural decline--equivalent to 73.5 percent--in the number of cases, with such decline occurring prior to the immplementation of EPI in 1979. This decline pattern continued during implementation of EPI to 1980, after which--by 1982--the incidence of diptheria exhibited a major increase of nearly 30 fold.65 Sourced
Whooping Cough (Nigeria)
shows that a significant increase in the whooping cough morbidity rate (1973 to 1974), was followed by a sharp natural decline from 1974 to 1975 equivalent to 91 percent. The very slight incline which followed up to 1979--when EPI was introduced--still posed an 86.5 percent lower morbidity level than in 1974. Post EPI data indicate a short lived slight decline, followed by an increase in morbidity of 34 percent over the ensuring two years.66 Sourced
Poliomyelitis (Dominican Republic)
reveals that in the period of 1980 to mid 1983--before implementation of EPI the poliomyelitis morbidity rate underwent a natural decline equivalent to 98.5 percent to wheat is practically an eradication level of only 1 per million. EPI was followed by a continuing natural decline to zero, however the incidence of poliomyelitis then underwent a minor increase for two years, and gradually returned to a zero level in 1980.67 Sourced
Measles (Dominican Republic)
indicates that in the period of 1980 to late 1985--before implementation of EPI the measles morbidity rate underwent a natural decline equivalent to 88 percent. Upon introduction of EPI in late 1985, the natural decline continued for a brief period, halted and then measles more than doubled from its 1986 and 1987 levels.68 Sourced
Diphtheria (Dominican Republic)
shows that in the period of 1978 to mid 1985--before implementation of EPI--the diptheria morbidity rate underwent a natural decline equivalent to 81.5 percent. Upon introduction of EPI in mid 1985, the natural decline continued for a brief period, and then by 1987 the diptheria case rate more than doubled from its 1986 level. The disease than returned to its natural rate of decline, proceeding to a very low level in 1989.69 Sourced
Pertussis (Dominican Republic)
reveals that in the period of 1978 to mid 1985--before implementation of EPI the pertussis (whooping cough) morbidity rate underwent a natural
decline equivalent to 84.5 percent. Upon introduction of EPI in mid 1985, there was a
slight rise and then return to the earlier natural decline pattern reaching its lowest
level by 1988. However, by 1989 the pertussis morbidity rate nearly tripled from its 1988
level.70
Sourced
Tetanus (Dominican Republic)
indicates that in the period of 1979 to mid 1985--before implementation of EPI the tetanus morbidity rate underwent a natural decline equivalent to 74 percent. Upon introduction of EPI in mid 1985, the natural rate of decline continued for a brief period to 1986. However, by 1988 the incidence of tetanus had more than tripled from its 1986 level, and then by 1988 returned to its earlier natural decline pattern, reaching a level in 1989 still higher than its 1986 level.71 Sourced
Neonatal Tetanus (Dominican Republic)
shows that in the period of 1978 to
the end of 1985--before the implementation of EPI (tetanus toxoid for
expectant mothers)--the neonatal tetanus morbidity rate underwent a
natural decline equivalent to 98.5 percent. Upon introduction of EPI in
late 1985, the natural rate of decline continued for a brief period to
1987. However by 1988 the incidence of neonatal tetanus had increased by
nearly five fold over its 1987 rate, and then by 1989 declined to a
level still higher than it was in 1986.72
Sourced
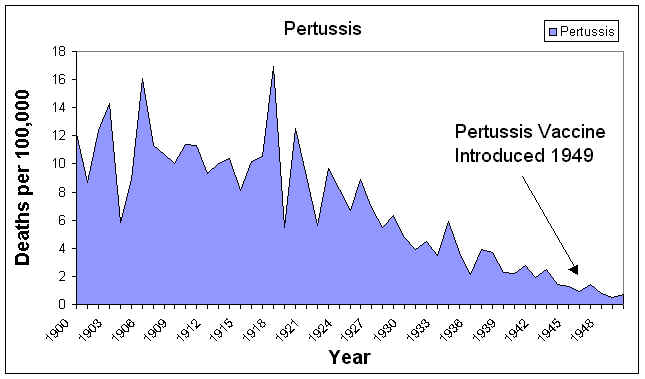
Pertussis deaths graph USA
DECLINE IN DEATH RATES FROM INFECTIOUS DISEASE---AUSTRALIA
taken from Greg Beattie's excellent book "Vaccination A Parent's Dilemma"
 Source