Smallpox graphs
[back] Graphs
[These are taken from two books by Alfred Wallace and J.T.
Biggs. Biggs is notable as he provided the stats for the Leicester
experiment where they gave up vaccination for over 30 years, providing a control
that exposed vaccination completely. Not something they allowed to happen
again, and you can see why. The Amish are one of the few notable
exceptions, as
Dan Olmsted found---no autism.]
Graphs from
Wallace book
[1898 Book] VACCINATION A DELUSION by ALFRED RUSSEL WALLACE
GRAPH
1 The main teaching of this graph.......is the striking correspondence in average rise and fall of the
death-rates of small-pox, of zymotics, and of all diseases together. This correspondence
is maintained throughout the whole of the first part, as well as through the whole of the
second part, of the graph; and it proves that small-pox obeys, and always has obeyed,
the same law of subservience to general sanitary conditions as the other great groups of
allied diseases and the general mortality. Looking at this most instructive
graph, we
see at once the absurdity of the claim that the diminution of small-pox in the first
quarter of our century was due to the partial and imperfect vaccination of that period.
Equally absurd is the allegation that its stationary character from 1842 to 1872,
culminating in a huge epidemic, was due to the vaccination then prevailing, though much
larger than ever before, not being quite universal—an allegation completely disproved
by the fact that the other zymotics as a whole, as well as the general mortality,
exhibited strikingly similar decreases followed by equally marked periods of average
uniformity or slight increase, to be again followed by a marked decrease. There is here no
indication whatever of vaccination having produced the slightest effect on small-pox
mortality.
GRAPH 2 The second
graph shows that, even taking the Commission’s favourite method of
comparing the zymotics separately with small-pox, all of them except measles show a
similar or a greater decrease during the period of official registration, and also agree
in the periods of slight increase, again proving the action of the same general causes
(which I have pointed out at p. 37), and leaving no room whatever for the supposed effects
of vaccination.
GRAPH 3
Graph 3. shows that similar phenomena occurred in England and Wales as a whole, the
other zymotics and the total deaths obeying the same laws of increase and decrease as
small-pox. Comparison with graph
1. shows the much greater severity of small-pox
epidemics in London, illustrating the fact, which all the statistical evidence of all
countries strikingly enforces, that small-pox mortality is, other things being equal, a
function of density of population, while it pays no regard whatever to vaccination.
This is further shown by the short, thick dotted line which exhibits the total number of
vaccinations since 1872, when private as well as public vaccinations were first officially
recorded, and which proves that the continuous decrease of vaccination since 1882
has been accompanied by a decided decrease, instead of an increase, in small-pox
mortality.
GRAPH 4
Graph 4. shows the statistics of mortality in Ireland and Scotland from small-pox
and certain chosen zymotics, from the tables which were laid before the Commission by the
official advocates of vaccination. These show two striking facts, which the Commissioners
failed to notice in their Final Report. First, the smaller amount of small-pox
mortality in Ireland than in Scotland, the latter being alleged to be well vaccinated, the
former imperfectly so; and, secondly, the similar difference in the two chosen diseases
and the general parallelism of the two. Here again we see clearly the influence of density
of population, Scotland having a very much larger proportion of its inhabitants living
in large manufacturing towns.
GRAPH 5 The next three Graphs, 5.,
6., and
7., show small-pox mortality in Sweden,
Prussia, and Bavaria— countries which at previous enquiries were adduced as striking
examples of the value of vaccination. They all show phenomena of the same character as our
own country, but far worse as regards epidemics in the capitals; that of Stockholm, in
1874, causing a death-rate more than 50 per cent. higher than during the worst epidemic of
the last century in London! The graph of small-pox and zymotics in Bavaria is given
merely because the statistics were brought before the Commission as a proof of the
beneficial results of vaccination in well vaccinated communities. It was alleged by
Dr. Hopkirk that almost the whole of the population were vaccinated, and admitted by
him that of the 30,742 cases of smallpox in 1871 no less than 95.7 per cent. were
vaccinated! The epidemic was, however, less severe than in Prussia, again showing the
influence of density of population less than one seventh of the Bavarians inhabiting towns
of over 20,000, while one-fourth inhabit similar towns in Prussia; but we see that during
the latter half of the period chosen small-pox greatly increased, and the other zymotics
remained very high, indicating general insanitary conditions. And this case was specially
brought before the Commission as a proof of the benefits of vaccination! In their Final
Report the Commissioners omit to point out that it really indicates the very reverse.
GRAPH 6
GRAPH 7
GRAPH 8
GRAPH 9 This Graph shows various
Death-Rates in Leicester, in five-year Averages.
GRAPH 10 The
upper portion of this diagram shows the Infant Mortality of London
from 1730 to 1830. From 1840 to 1890 shows the Infant
Mortality of England. The Lower part of the Table shows, on a larger
scale, the Infant Mortality of London, under one year, as given by the
Registrar-General in his Annual summary for 1891
GRAPH 11 Army and Navy.
GRAPH 12 Smallpox Mortality per 100,000. The Army and Navy as compared
with Ireland.
Graphs from Biggs
book
LEICESTER: SANITATION versus VACCINATION BY J.T. BIGGS
J.P.
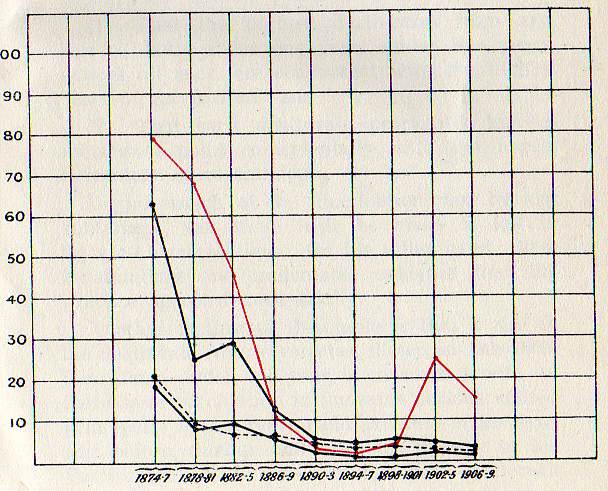
GRAPH A
ERYSIPELAS. LEICESTER.
IN GROUPS OF FOUR YEARS. 1874—1909.
See the drop of death-rate
from Erysipelas with the drop in smallpox vaccination.
|
 |
|
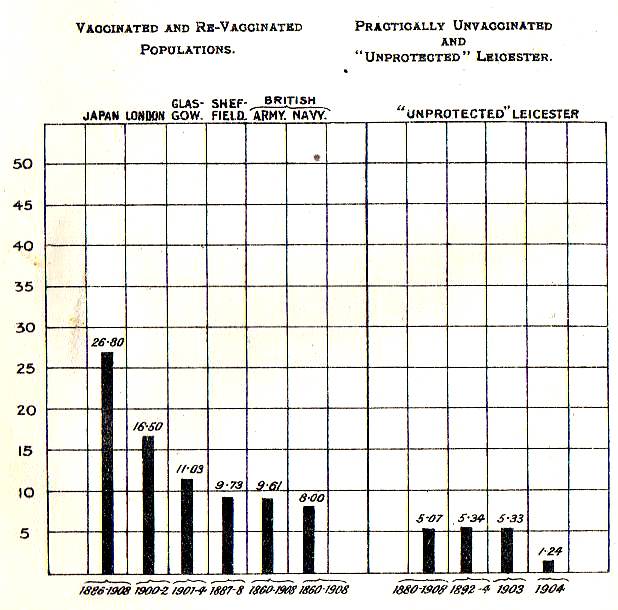
GRAPH C
SMALLPOX FATALITY RATES, percent, of
cases, in vaccinated and re-vaccinated populations compared with
"unprotected" Leicester, in varying periods from 1860 to 1908.
See:
Case mortality
|
 |
|
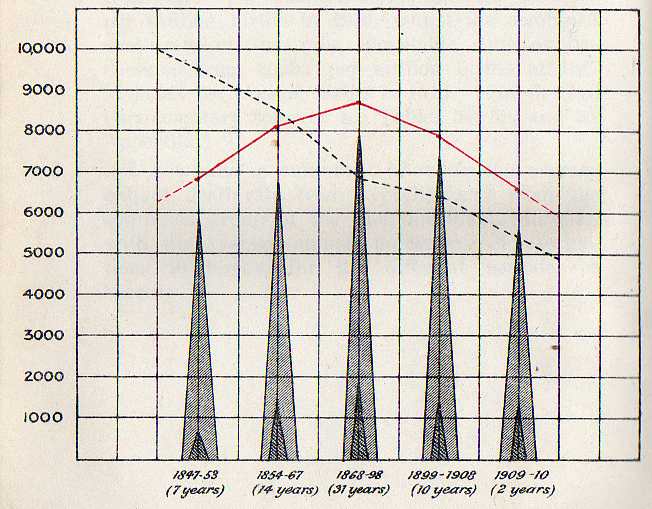
GRAPH D
INOCULABLE DISEASES. ENGLAND AND WALES. 1847-1910.
The Small Dark Pyramids show the actual death-rate from
syphilis per million births.
The Large Pyramids show the death-rate from nine inoculable diseases, including
syphilis, per million births.
The Black Dotted Curve shows the death-rate from all other causes per
million births.
The Red Curve shows the
percentage of vaccinations to births.
|
 |
|
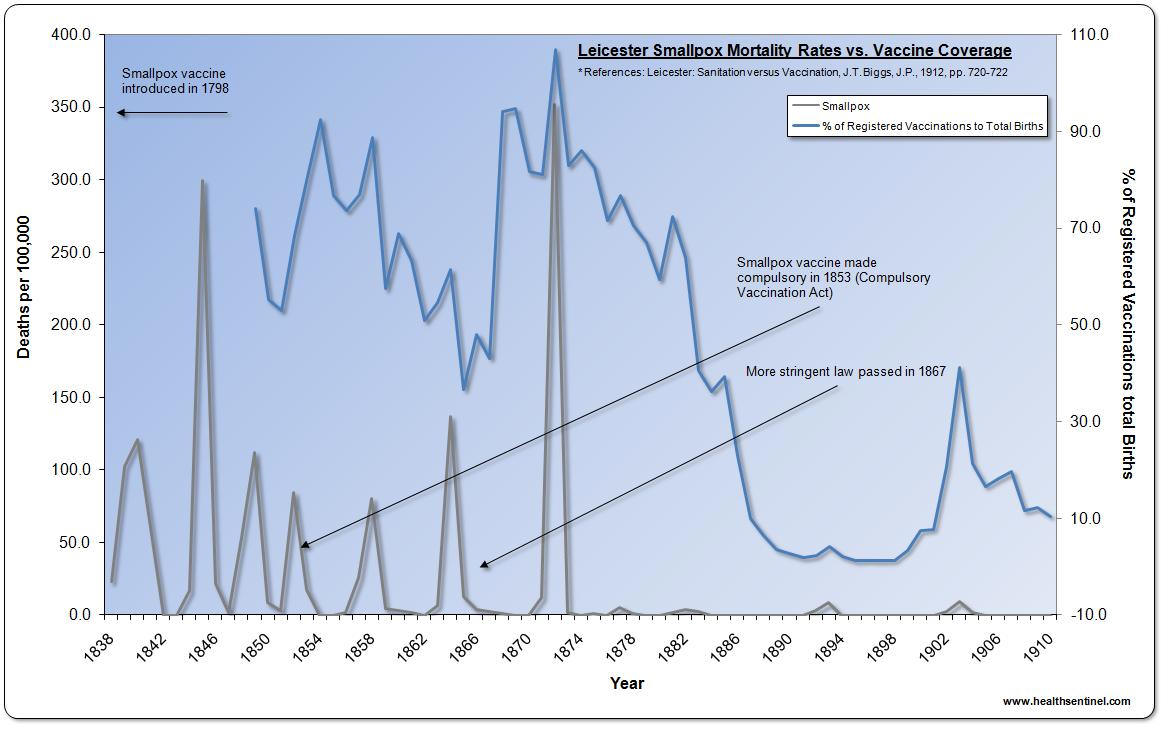
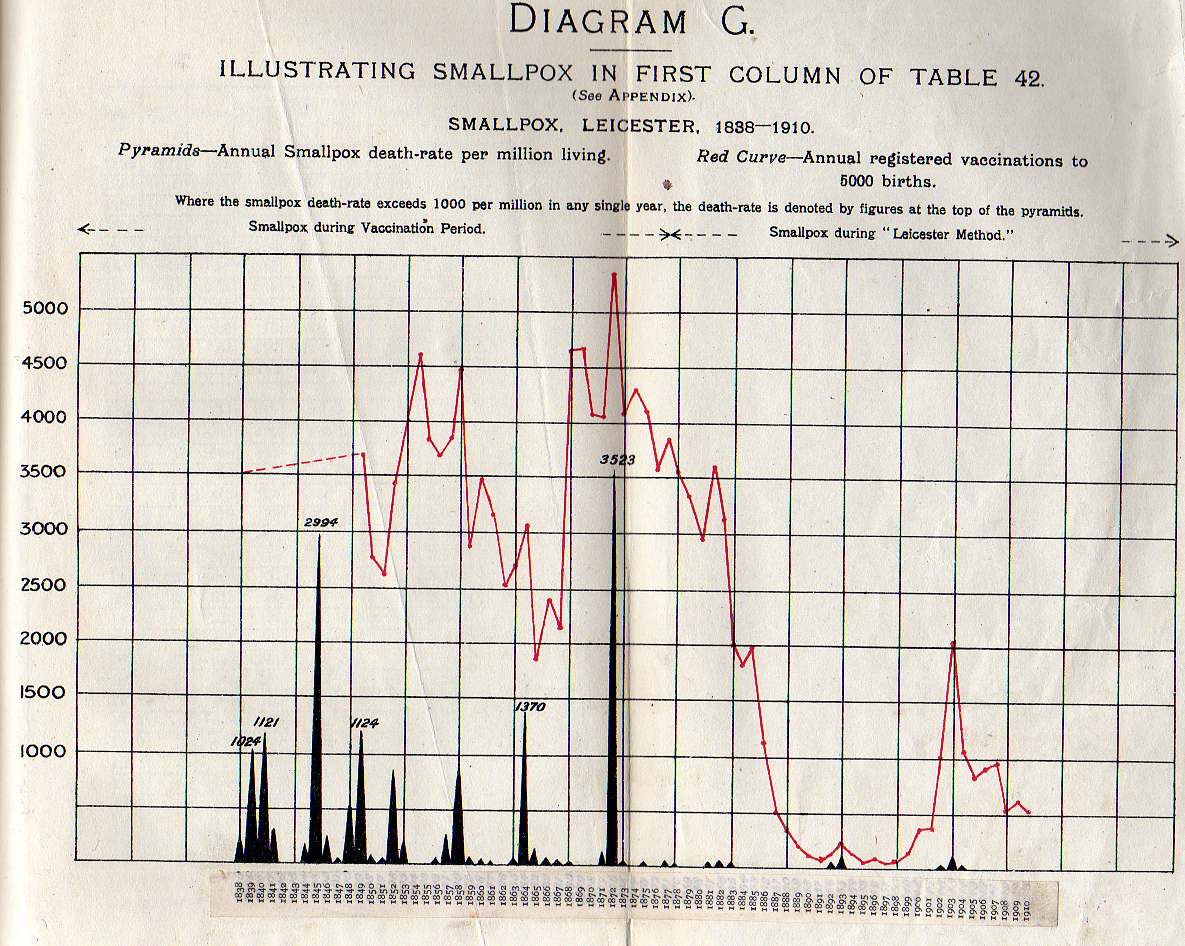
GRAPH
G
BOROUGH OF LEICESTER, for
each of the years 1838-1910, the number of deaths from each of the seven
principal zymotic diseases per
million living, with, for each of the years 1849-1910, the percentage of
registered vaccinations to births.
|
 |
|
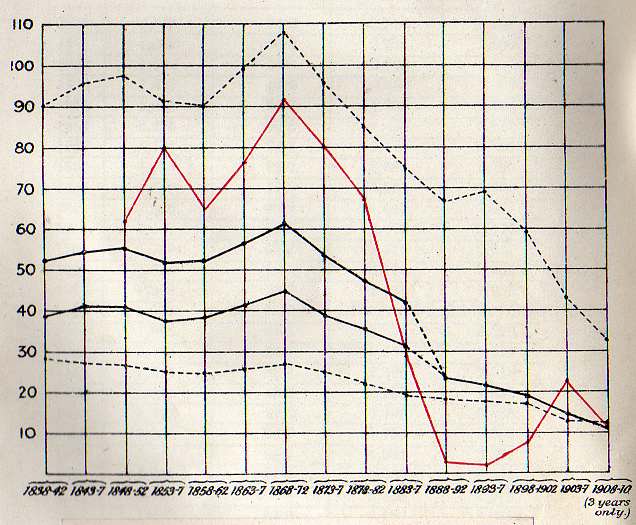
GRAPH J
ILLUSTRATING TABLE 49.
LEICESTER. DEATH-RATES UNDER 6, 10, AND 16 YEARS. AND AT ALL AGES.
After 1883-7, ages under 10 and 15 are merged into age under 20, as shown by
dotted lines connecting solid curves.
The lesson of this table (49)
is that when we pinned our faith to the prophylactic and saving virtues of
vaccination—from 1868 to 1872—no fewer than an annual average of 239 out of
every 1,000 infants born died within twelve months of their birth. Now, having
seen the error of our ways, and discarded the nostrum, instead of 239 deaths,
there is only an annual average of 128 deaths per 1,000 births, or a decrease of
111 per thousand, being a saving of 46 per cent. These figures represent an
annual saving of over 600 infant lives each year in Leicester.
In other words, instead of
1,315 infants dying within twelve months of their birth each year, as in
1868-12, there are now only 702 such deaths. Even these are too many, but,
fortunately, the trend is still in the right direction.
The saving of children's
lives under five years of age is on the same lines of progress. Whereas in the
high vaccination period of 1866-72 there were 107 deaths per thousand living at
that age, now there are only 34 per thousand, being a decrease of 73 per
thousand, or a saving of 68 per cent. This represents a saving of over 2,200
lives each year of children living under five.
In other words, if the
death-rate under this heading had continued as in 1868-72, no less than 3,109
children under five years of age would have died within each year, instead of
only 890. These remarkable results show us where the saving of life has been
effected by our sanitary work, minus vaccination.
The preservation of life
under 15 is equally remarkable, but as this age is now merged in that of
twenty years, which is practically an adult age, it is unnecessary to deal with
it in this chapter. I, therefore, relegate it to that on the general death-rate
of Leicester. |
|
[Book 1990, updated 1998] UNIVERSAL IMMUNIZATION
Medical Miracle or Masterful Mirage By Dr. Raymond Obomsawin
|
reveals that in England and Wales there was a continuing decline in the
annual death rate from smallpox, with a reduction in mortality of
roughly 300 per million to virtually 0, taking place in the 60 year
period following the middle of the last century. This table further
illustrates that the progressive rate of decline was severely
disrupted--with a roughly 275 percent increase in mortality from the
disease--occurring immediately after smallpox vaccination laws were
enforced. Sourced |
 |
|
reveals, in the 17 year period preceeding the WHO Smallpox
Eradication Program, a progressive drop to nearly one half, in the number of countries
reporting smallpox morbidity.62
Sourced |
 |