[back] Book: VACCINATION A DELUSION by ALFRED RUSSEL WALLACE (split into chapters)
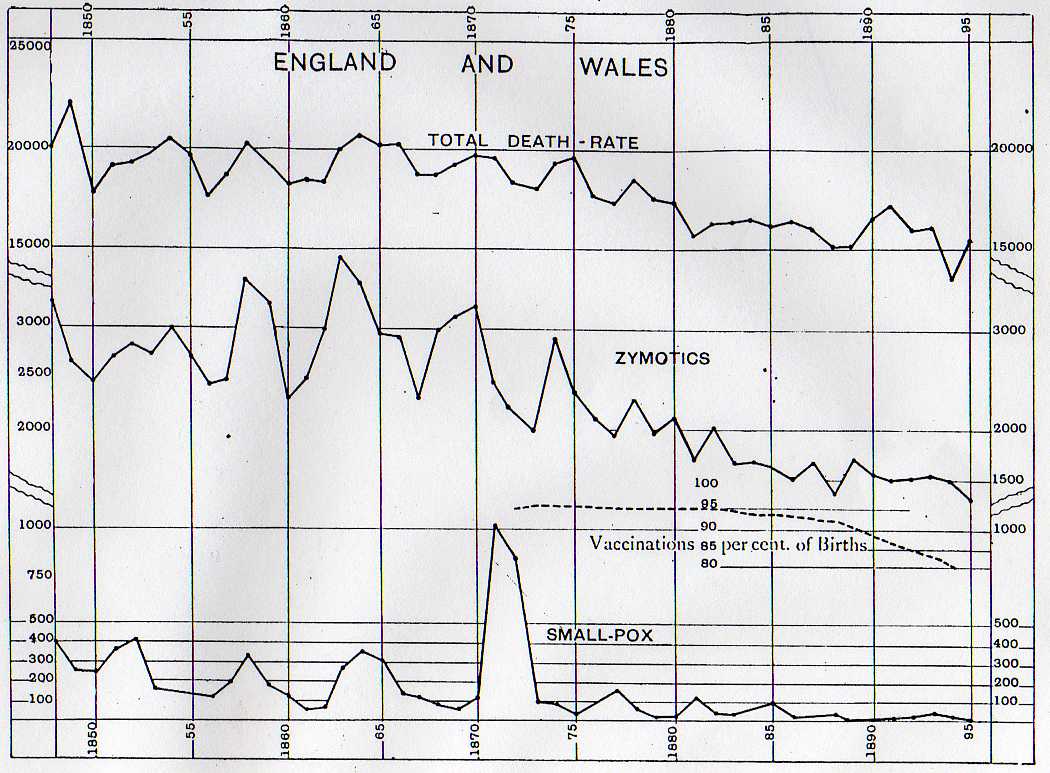
Small-pox, Vaccinations, Zymotics, and. Total Death-rate in England and Wales.
Small-pox from Final Report, Tab. B. p. 155, and Registrar-General's Report, 1895, Table 24.
Vaccinations from Final Report, p. 34.
Zymotic diseases from Registrar-General's Report (1895), Table 24, Columns 3 to 9.
Total Death-rate from Registrar-General's Report, 1895, Table 3.
N.B.—Each of the lines showing Death-rates has its own vertical scale showing the rate per million living, in order to allow of the four separate rates being shown on one diagram so that their corresponding rise or fall may be compared.
[back] CHAPTER 6: SUMMARY AND CONCLUSION Graph 3. shows that similar phenomena occurred in England and Wales as a whole, the other zymotics and the total deaths obeying the same laws of increase and decrease as small-pox. Comparison with graph 1. shows the much greater severity of small-pox epidemics in London, illustrating the fact, which all the statistical evidence of all countries strikingly enforces, that small-pox mortality is, other things being equal, a function of density of population, while it pays no regard whatever to vaccination. This is further shown by the short, thick dotted line which exhibits the total number of vaccinations since 1872, when private as well as public vaccinations were first officially recorded, and which proves that the continuous decrease of vaccination since 1882 has been accompanied by a decided decrease, instead of an increase, in small-pox mortality.